Technical Analysis of the Financial Markets: a definition-to-test companion
Use Murphy as a technical-analysis reference, then convert one chart concept into timed inputs, a baseline and a falsifiable experiment.
Editorial reading notes and source-based resource assessments, not a claimed cover-to-cover reviewer programme. Edition, access and evidence limits are stated.
Match the reference to the learning gap
The publisher identifies John J. Murphy's Technical Analysis of the Financial Markets as a reference covering chart interpretation, indicators and related analysis. That supports a subject-based reading choice. It does not establish that this publication read every page, reproduced the examples or measured returns from readers using the methods. Confirm the actual edition and format before attributing a particular definition.
The practical fit is someone who needs a vocabulary and a way to locate technical concepts. If the missing skill is research design or order accounting, pair the reference with an appropriate protocol rather than expecting a broad charting book to supply every detail of a complete executable system.
An original moving-average calculation
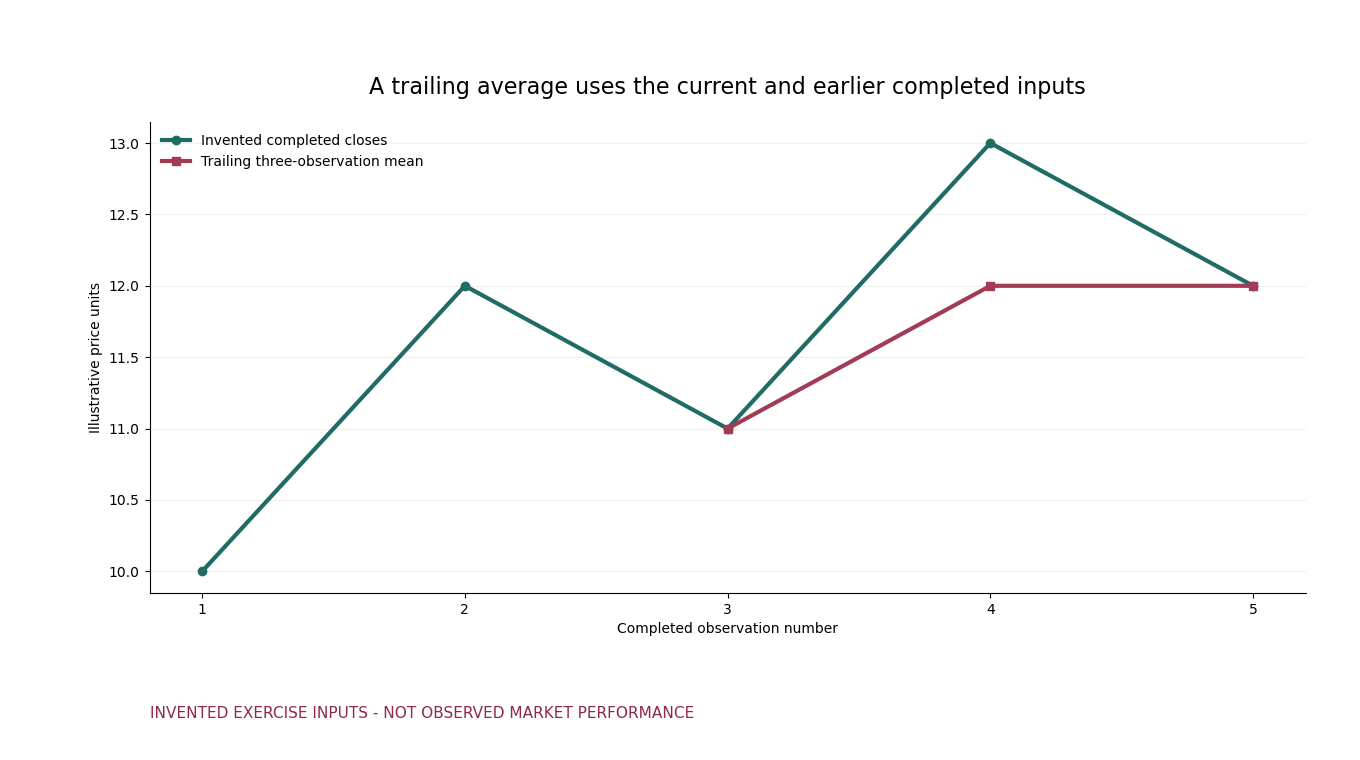
Use an invented sequence of completed closes: 10, 12 and 11 price units. A trailing three-observation simple average at the third completed observation is 11. Write the formula, observation interval and earliest availability beside that result. A centred average would use a different information window and should not be treated as the same causal input.
The exercise is ours, not a quoted example or a threshold attributed to Murphy. Its purpose is to make an indicator definition reproducible before giving it trading meaning. An average describes a transformation of prices; the arithmetic alone does not demonstrate predictive ability or identify an appropriate position.
Separate a visual relationship from an entry rule
A chart may show price above an average without specifying when that condition is evaluated, whether a crossing is required or what happens if the next observation reverses. Write each choice explicitly. Completed bars, intrabar updates and a delayed notification can produce different eligible decisions even when the final chart looks identical.
Choose the first permissible order time and the intended order type. Knowing the completed close later does not automatically justify a fill at that same close. If only bar extremes are available, retain an ambiguity policy for competing stop and target touches instead of choosing the favourable sequence from the picture.
Give the concept a baseline and rejection rule
Compare the proposed interpretation with a simpler rule under the same universe, period, exposure and execution assumptions. A transformed price series can capture broad directional exposure without demonstrating an incremental advantage. Decide what would reject the hypothesis before testing variants.
Record lookbacks, thresholds, contexts and abandoned choices. A catalogue of named indicators is not a collection of independent proven edges. Combining several transforms of the same observations also does not automatically add independent information. Preserve the complete choice history so an appealing final chart is not mistaken for one predeclared experiment.
Choose a bounded comparison resource
Steve Nison's candlestick reference is a more focused reading candidate when the immediate gap is describing open, high, low and close geometry. A quantitative research text is more appropriate when the gap is causal evaluation, data handling or economic comparison. These are task differences, not a universal ranking of authors.
Use a permitted sample or contents item to decide whether the explanations address your current gap. A historical example can illuminate a definition while the market structure or available data requires a current check. No publisher testimonial, sales description or comprehensive subject coverage is converted into an independent performance finding here.
Keep a definition register rather than a profit promise
For one concept, save the edition, passage location you actually inspect, your paraphrase, the mathematical definition, availability clock and unresolved implementation choices. Distinguish an author's rule from a threshold or exit you introduced. Check whether a second reader could label the same completed observations consistently.
The blank export records that learning output without inventing completed reading sessions. This companion supplies no full-edition review, star score, reader-return sample or guaranteed strategy. The useful result is a clearly specified concept and a test plan that can fail honestly. A correct indicator formula is a prerequisite for research, not its profitable conclusion.
Reading decision checkpoints
| Question | Useful output | Do not infer |
|---|---|---|
| Definition | Formula and actual inspected passage | An invented threshold attributed to the author |
| Timing | Completed input and first permissible order | Later chart used as earlier knowledge |
| Evaluation | Compatible baseline and search history | An indicator catalogue treated as proven edges |
 Download blank reading record (CSV)
Headers only. No completed reading sessions or reader outcomes are supplied.
Sources and scope
Choose a book by the skill you need
Definitions and predictive tests stay separate
The new chart-reading guide treats a numerical pattern definition as an intermediate output, not a favorable strategy result. Preserve the selected price basis, equality treatment, window and causal clock. A reader-added threshold should not be attributed to Murphy without an actual passage. The original worked moving-average data and figure remain unchanged. Correct geometry and source-linked terminology can clarify a testable question without establishing expected return, model admission, native exit behavior or independently certified account performance.